Reports your data writes for you
Burndown to cycle time, straight from the board
Kapvel's reports read directly from your sprints and issues, so they are always current and never configured. Open a project and the burndown, velocity, cumulative flow, and cycle-time views are simply there.
For Scrum ceremonies
Sprint burndown tracks remaining points day by day; velocity compares committed and completed across sprints; epic progress rolls up story completion. Sprint review prep becomes opening a tab.
For flow
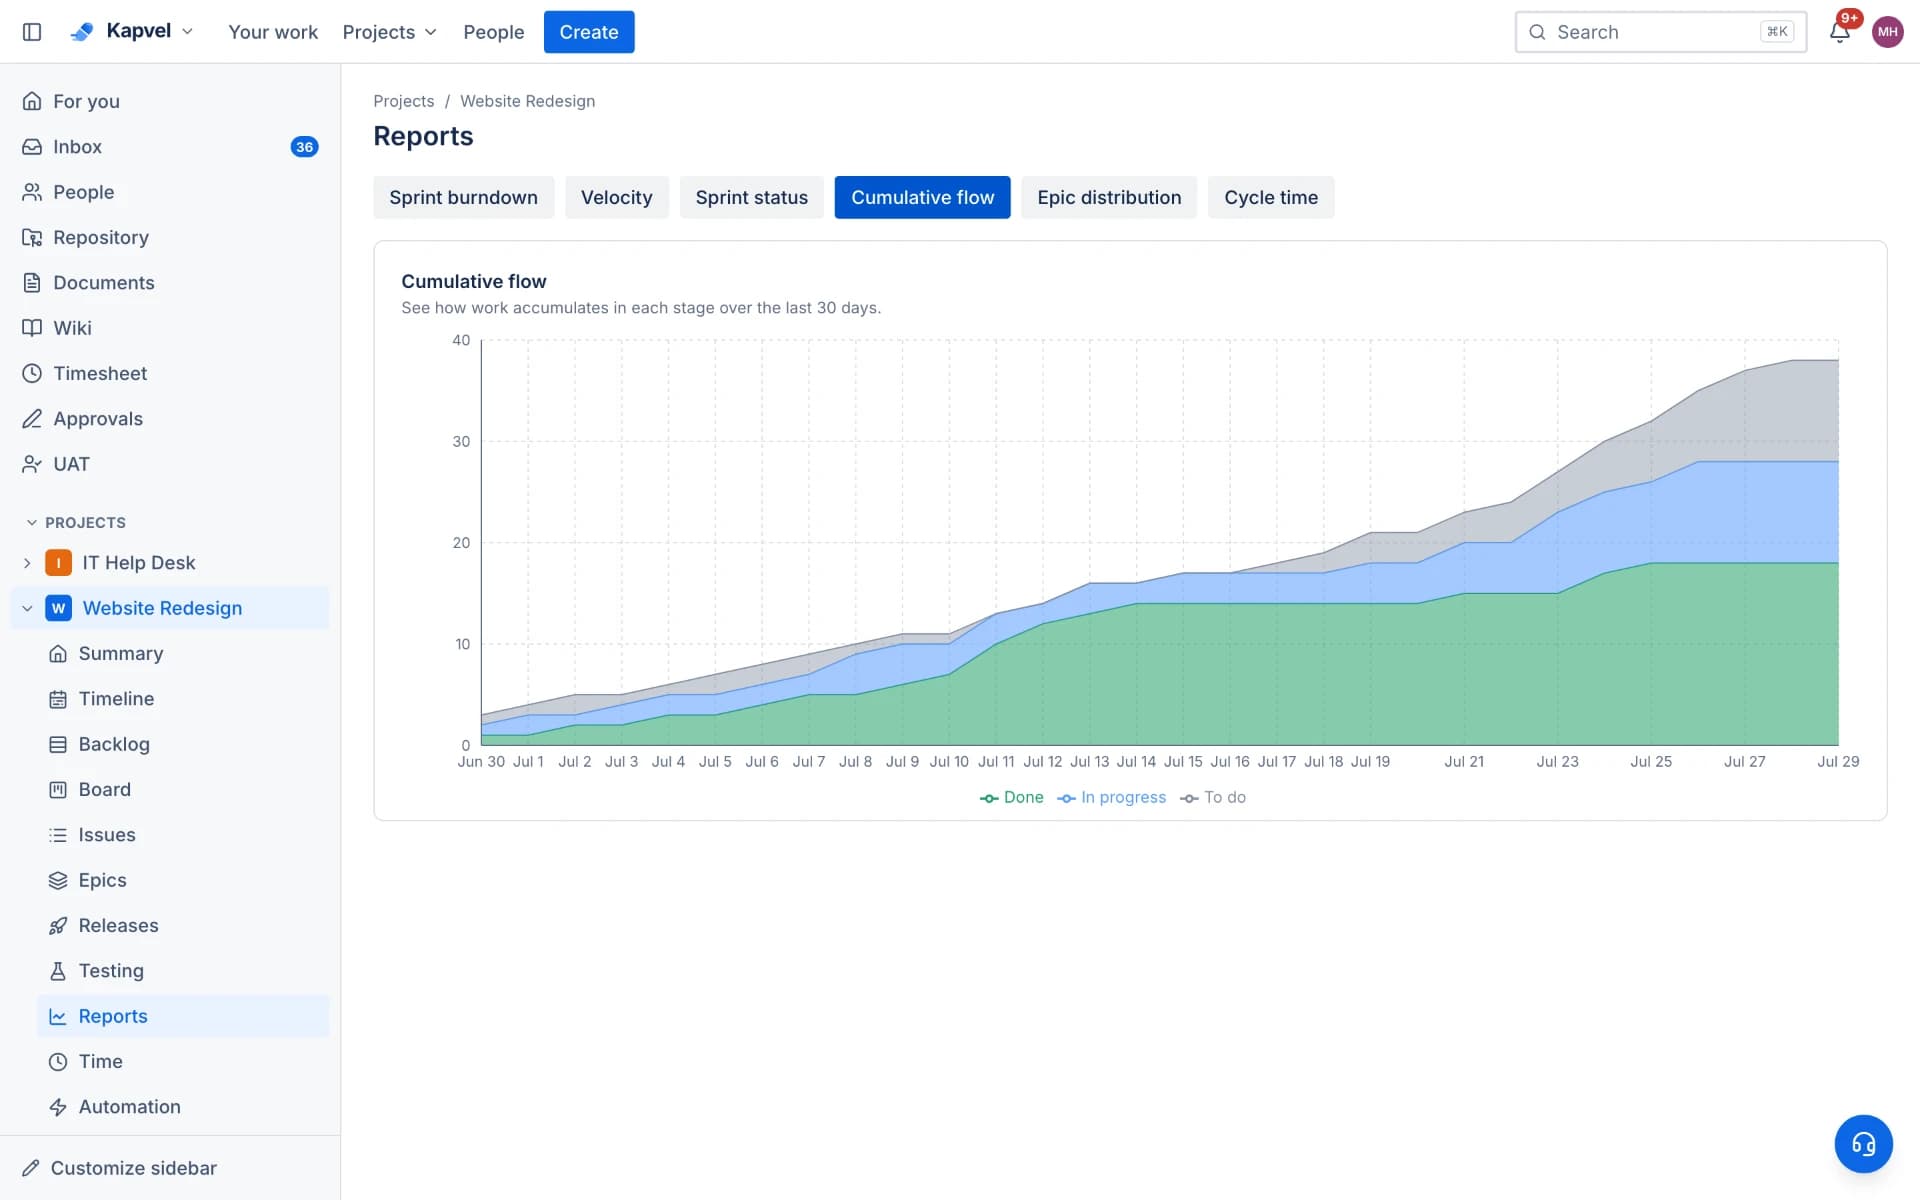
Cumulative flow shows WIP accumulating before it becomes a problem; cycle time distributions expose where work stalls. Filter by assignee, epic, or label to localize the bottleneck.
For people and cost
Workload views balance assignments across the team, and time reports (with optional hourly rates) turn logged hours into effort and cost summaries — exportable when finance asks.
See it live
This is a real interactive demo — click around, nothing to install.
Answers, not spreadsheets homework
Burndown, velocity, cumulative flow, cycle time, sprint status, epic distribution, and team workload — generated live from your board. No exports, no formulas, always current.
Sprint burndown
Remaining points vs. the ideal line
Velocity
Committed vs. completed, last 5 sprints
Cumulative flow
Work in each status over time
Cycle time
Days from started to done, per issue
Frequently asked questions
Do reports need setup?
No — they derive from your boards, sprints, and time entries automatically. If the data exists, the chart exists.
Which agile charts are included?
Sprint burndown, velocity, cumulative flow, cycle time, epic progress, workload, and time/cost reports.
Keep exploring
Your team, out of eight tabs by Friday
Start free, invite the team, and import your existing projects in minutes. Boards, docs, and support — finally on speaking terms.